Key KPIs to Watch in US Shared Micromobility (Next 6 Months)
Key Performance Indicators (KPIs) in the US shared micromobility market over the next six months include ridership, availability, trip duration, safety incidents, revenue, customer satisfaction, and environmental impact, reflecting a focus on growth, efficiency, and sustainability.
Understanding the trajectory of shared micromobility in the United States requires a keen eye on specific metrics. Let’s delve into what are the key performance indicators (KPIs) to watch in the US shared micromobility market over the next 6 months, offering a compass for industry observers and stakeholders.
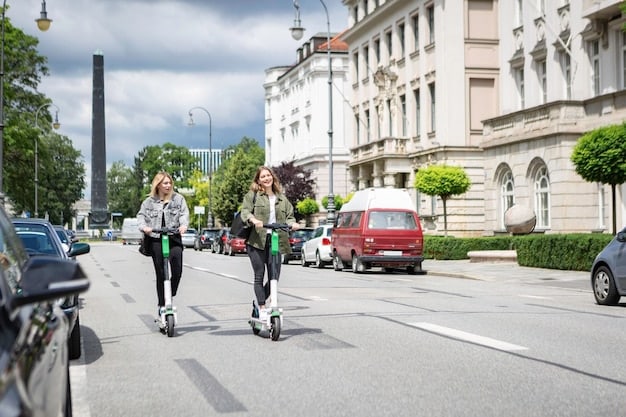
Ridership and Market Penetration
Ridership stands as the quintessential gauge of shared micromobility adoption. This encompasses tracking the total number of trips taken and the unique users engaging with shared scooters and bikes.
Monitoring Growth Trends
Evaluate whether ridership is expanding, contracting, or plateauing in key markets. Seasonal variations and promotional campaigns will significantly influence these figures.
Penetration Rate Analysis
Determine the percentage of the population using shared micromobility services within specific cities. This provides insight into the potential for further market expansion.
- Total Trips: The aggregate number of journeys completed.
- Unique Users: The count of individual riders utilizing the service.
- Trip Frequency: The average number of trips taken per user.
Ridership KPIs provide a fundamental understanding of market size and engagement. By monitoring these trends, stakeholders can better assess the overall health and potential of shared micromobility services.

Availability and Vehicle Distribution
The accessibility of shared micromobility options directly influences usage. Optimal vehicle distribution ensures that scooters and bikes are readily available when and where riders need them.
Coverage Area
Assess the geographic area served by shared micromobility services. Expansion of the coverage area can unlock new ridership opportunities.
Vehicle Density
Measure the number of vehicles per square mile in different zones. High-density areas should have sufficient vehicle availability to meet demand.
Strategic vehicle distribution plays a critical role in maximizing ridership and user satisfaction. Companies must continually refine their approaches to ensure vehicles are deployed effectively.
Trip Duration and Distance
Analyzing the length and duration of trips reveals insights into user behavior and trip purpose. These KPIs help identify common use cases and optimize service offerings.
Average Trip Duration
Calculate the mean time spent per trip. This KPI can indicate whether micromobility is primarily used for short commutes or longer recreational rides.
Average Trip Distance
Determine the average distance covered per trip. This provides additional context on trip purpose and potential displacement of other transportation modes.
- Peak Usage Times: Identify periods of high demand for strategic vehicle deployment.
- Popular Routes: Understand common travel patterns to optimize infrastructure planning.
- Trip Purpose Analysis: Survey users to determine the primary reasons for using shared micromobility.
By understanding trip patterns, operators can refine their services, improve vehicle placement, and cater to users’ specific needs. This data-driven approach fosters greater adoption and user satisfaction.
Safety Incidents and Regulatory Compliance
Safety remains paramount for the long-term sustainability of shared micromobility. Tracking incidents and adhering to regulations builds public trust and mitigates risks.
Incident Reporting Rate
Monitor the number of reported accidents and safety incidents per mile traveled. Lower incident rates indicate improved safety measures.
Compliance with Local Laws
Ensure adherence to all applicable regulations, including speed limits, parking restrictions, and helmet requirements.
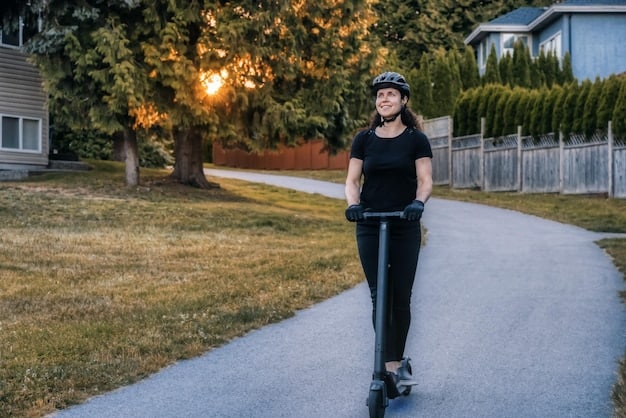
Proactive Safety Measures
Implement educational programs and safety features to promote responsible riding behavior. Transparency and collaboration with regulators are key to fostering a safe micromobility ecosystem.
Revenue and Profitability
Financial viability is essential for the sustainability of shared micromobility businesses. Monitoring revenue and profitability metrics helps ensure long-term success.
Revenue per Trip
Calculate the average revenue generated per ride. This reveals the effectiveness of pricing models and promotional campaigns.
Operating Expenses
Track costs associated with vehicle maintenance, charging, and operational logistics. Managing expenses efficiently is critical for profitability.
- Customer Acquisition Cost: Evaluate the expense of attracting new users.
- Customer Lifetime Value: Estimate the long-term revenue potential of each user.
A keen focus on revenue and expense management is crucial for achieving profitability in the competitive shared micromobility market. Data-driven financial strategies empower operators to thrive in the long run.
Customer Satisfaction and Retention
Happy riders are repeat riders. Measuring customer satisfaction and retention rates provides insights into the overall user experience and service quality.
Net Promoter Score (NPS)
Gauge customer loyalty by asking riders how likely they are to recommend the service to others.
Churn Rate
Monitor the percentage of users who discontinue using the service over a given period. Lower churn rates indicate higher customer satisfaction.
Prioritizing customer satisfaction and building brand loyalty fosters long-term sustainability. Consistently delivering a positive user experience is paramount in the competitive micromobility landscape.
Environmental Impact
Micromobility’s environmental benefits drive its appeal as a sustainable transportation alternative. Quantifying the positive impact is crucial for promoting its adoption.
Carbon Emission Reduction
Estimate the decrease in carbon emissions achieved by replacing car trips with shared scooter and bike rides.
Mode Shift
Analyze the shift away from personal vehicles towards micromobility options in urban areas.
- Vehicle Lifespan: Optimize maintenance to maximize the lifespan of shared vehicles.
- Sustainable Charging Practices: Utilize renewable energy sources for charging fleets.
By measuring and communicating the environmental advantages of shared micromobility, operators can attract environmentally conscious riders and contribute to a greener urban future.
| Key Metric | Brief Description |
|---|---|
| 🚲 Ridership | Number of trips and unique users. |
| 🛵 Safety | Reported accidents per mile. |
| ♻️ Environmental Impact | Reduction in carbon emissions. |
| 👍 Customer Satisfaction | Net Promoter Score (NPS). |
FAQ
What is the primary goal of tracking KPIs in shared micromobility?
▼
The main purpose is to understand market performance, optimize operations, and ensure sustainability by monitoring key metrics like ridership and safety.
Why is ridership such a crucial KPI to monitor?
▼
Ridership indicates market demand and service utilization, reflecting the success in attracting and retaining users through convenient and accessible transportation.
How does environmental impact factor into micromobility KPIs?
▼
Environmental impact is monitored to quantify the benefits of reduced carbon emissions and decreased reliance on cars, supporting sustainability goals.
What role does safety play in assessing micromobility performance?
▼
Safety is crucial for building trust and mitigating risks. Monitoring incidents and ensuring regulatory compliance enhance public safety and promote responsible usage.
Why is customer satisfaction included as a key performance indicator?
▼
Customer satisfaction is vital as it directly impacts user retention and loyalty. Positive experiences foster long-term sustainability in the competitive transport market.
Conclusion
In conclusion, monitoring these KPIs is crucial for stakeholders in the US shared micromobility market. By understanding ridership trends, safety metrics, financial performance, and environmental impact, operators and policymakers can refine their strategies; this ensures sustainable growth and contributes to more efficient and eco-friendly urban transportation.


")


